Linear Regression
What is linear regression?
Linear Regression is a statistical tool used to quantify the linear relationship between a quantitative variable of interest and one or more explanatory variable(s). The resulting model can be used to evaluate evidence for hypotheses about the relationship and to make predictions under the following conditions.
1. The observations are representative of the population of interest and independent.
2. The residuals (errors) are normally distributed with common variance.
How to use this app?
Step 1: To use this app, go to the 'Dataset & Model' tab and upload your .csv type dataset, or select a sample dataset.
Step 2: Fit your model by inputting your desired regression equation in the form:
Designate interaction terms using the * or : symbol between the two variable names. Using the asterisk will include both variables and their interaction (recommended), whereas the colon will only include the interaction. For example, an interaction between explanatory variable 1 and 2 can be specified as follows.
Step 3: You can see the data and a correlation matrix of the numeric variables in the 'Dataset Summary' tab
Step 4: You can check the assumptions provided in the 'Assumptions' tab. We recommend assessing assumptions visually using the provided graphical summary and confirming using the numerical summaries. The app will provide results for a Breusch-Pagan test assessing common variance of the residuals and Shapiro-Wilkes (n ≤ 5000) or Kolmogorov-Smirnov (n > 5000) tests for normality. While these tests might be helpful, they can be rather sensitive for small sample sizes leading us to detect minuscule transgressions.
Step 5: You can check the effect of outlying, influential, or leverage points in the 'Outliers' tab. Many models exhibit some influential points and researchers should ensure that the results of their model hold when using a robust regression model.
Step 6: The ANOVA table for the regression model is reported in the 'ANOVA' tab.
Step 7: The resulting model and interpretation of key values can be found in the 'Interpreation' tab
Step 8 (Optional): If your model has an interaction, the appropriate analyses will be reported in the 'Interaction' tab.
Contact us
Please contact us if you have any questions at datascience@colgate.edu.
Example 1
Within the regression app, we provide data collected on a representative sample of n=558 White Americans by Cooley et al. (2022). The researchers aimed to assess whether beliefs that White people are poor are associated with the humanization of welfare recipients among White Americans who feel intergroup status threat—namely, those high in racial zero-sum beliefs.
If this were the case, it would suggest that the link between White-poor beliefs, the humanization of welfare recipients, and welfare policy support may be motivated by a desire to preserve the racial status quo.
The researchers used perceived agency of welfare recipients as a measure of humanization, and they wanted to evaluate whether White-poor and racial zero-sum beliefs affect this perception by controlling for education, income, political affiliation (Democrat or not) and their beliefs that Black people are poor.
Specifically, they hypothesized that the association between White-poor beliefs and the humanization of welfare recipients would be stronger among white Americans who also had higher racial zero-sum beliefs, indicating that an interaction term is necessary.
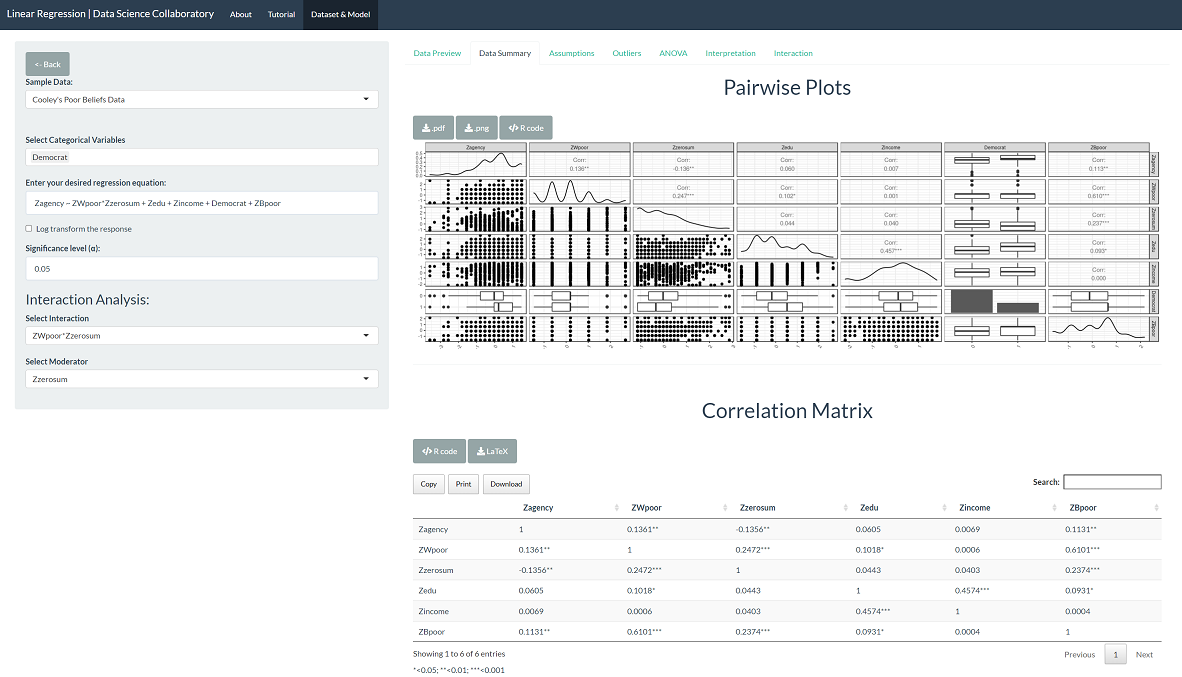
The data are quite noisy, and we can see that some variables are discrete. We see that the perceived agency of welfare recipients (humanization) is positively correlated with beliefs that White people are poor, beliefs that Black people are poor, and negatively correlated with zero-sum beliefs. Further, we can see that the perceived agency of welfare recipients (humanization) appears to be more prominent among Democrats than non-democrats.
While these findings provide some insight toward our research question, they are zero-order, meaning we look at the pairs of correlations independently without considering how all the explanatory variables work together.
The first step of linear regression analysis is to evaluate the assumptions. When we click 'Assumptions', the residuals are plotted.
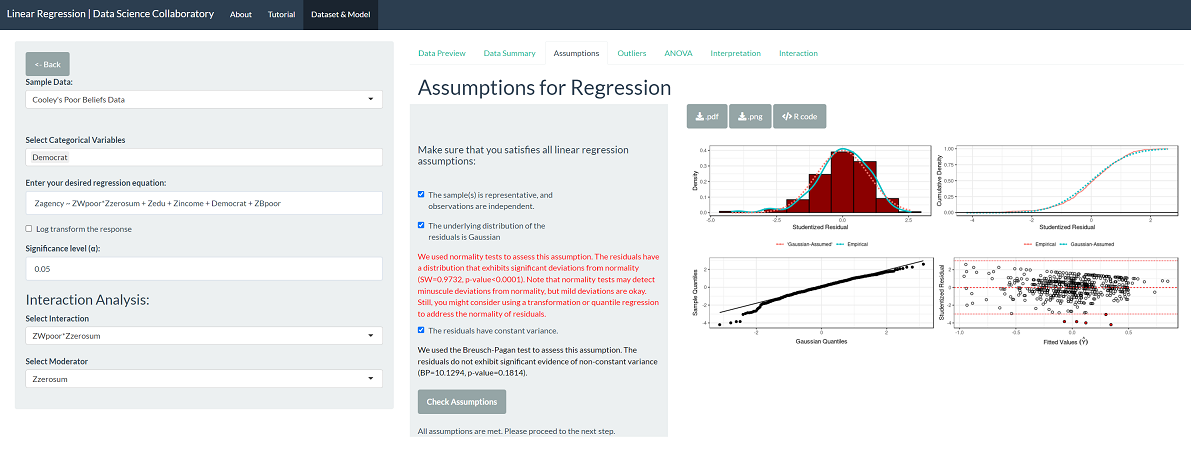
This plot shows that the residuals are roughly normally distributed as the density is symmetric and bell-shaped. The variance is roughly constant from left to right in the fitted values versus residuals plot. We see the boundary of the scale for perceived agency create a band of points from right to left.
Evaluating whether the observations represent the population of interest and are independent is more challenging. The researchers recruited a representative sample of White Americans living in the United States based on the region of the country, age, gender, and education through the Lucid Panels service. We assume the company ensures independent observations; e.g., responses from the same IP address should be filtered.
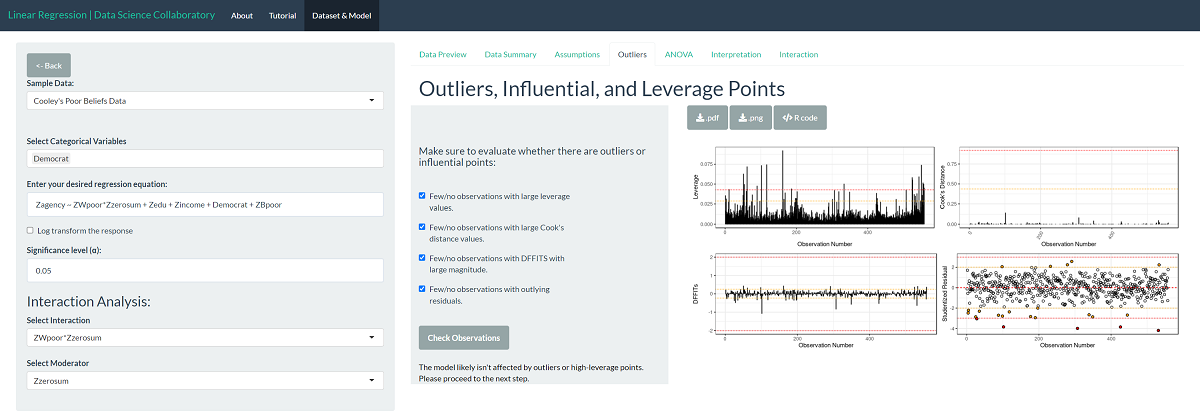
In the outliers, influential, and leverage points plot, we see several observations impact the fit of the regression. This may not be a big issue; for example, the extreme observations may balance each other. Still, we might consider fitting a robust model to confirm that just a handful of points do not drive the results we see in the later tabs.
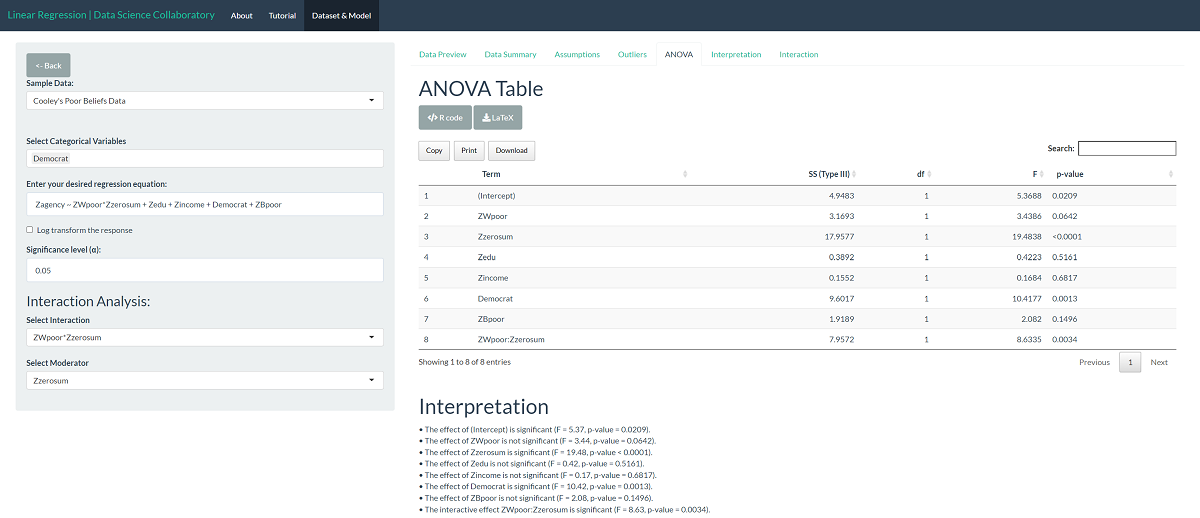
The ANOVA table shows us that the effect of racial zero-sum beliefs (F=19.48, p<0.0001), political affiliation (F=10.42, p=0.0013), and the interaction between White-poor and racial zero-sum beliefs (F=8.63, p=0.0034) are significant explanatory variables. Because we have a significant interaction, we report Type III sums of squares. Therefore, these tests indicate whether explanatory variables have statistically significant predictive ability when accounting for all other explanatory variables, including interactions.
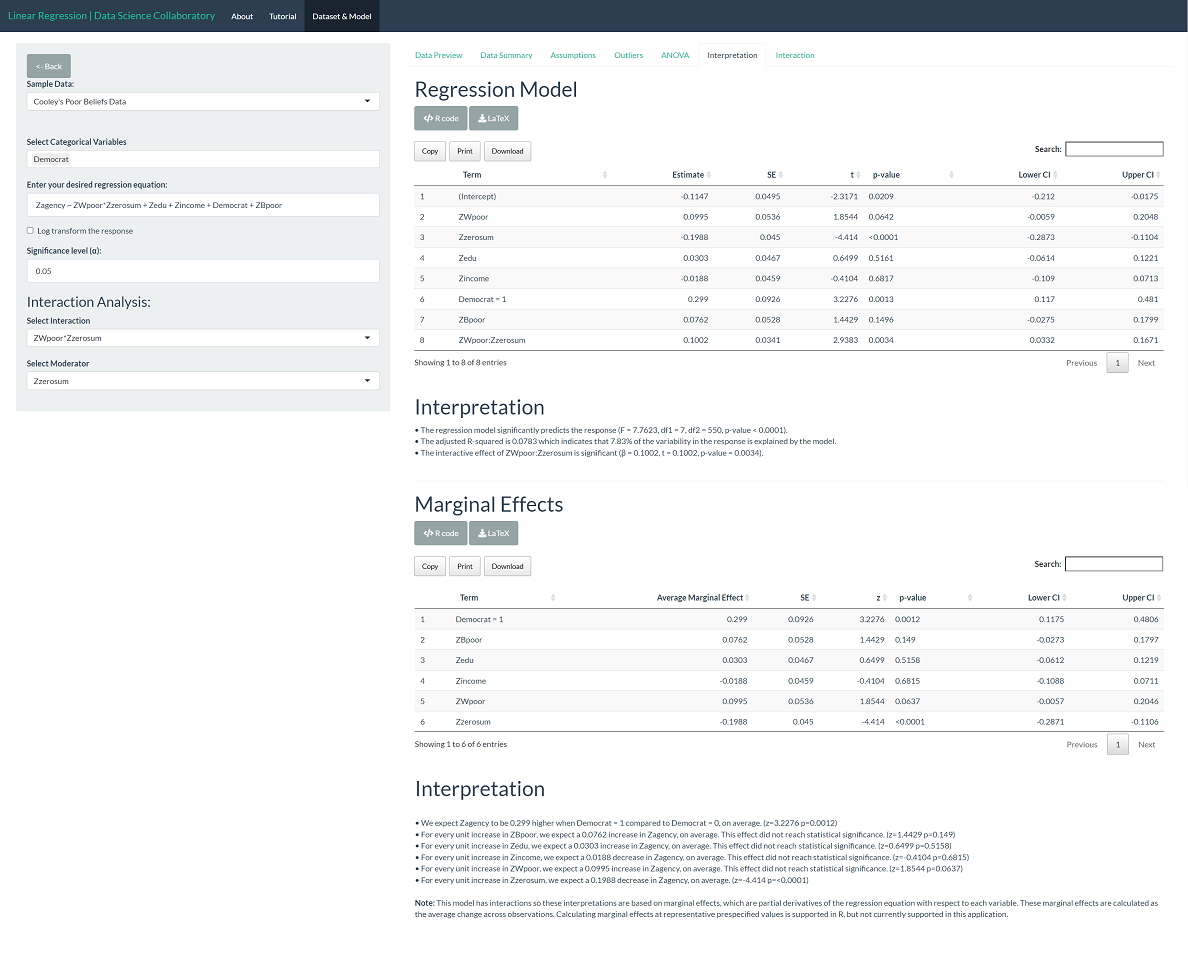
The regression model results mirror what we see in the ANOVA table. We noted that the data are noisy, which is reflected in the low adjusted R-squared that indicates that the model explains 7.83% of the variation in perceived agency of welfare recipients (humanization). While this might be discouraging, the social behavior of humans is wildly complex. Explaining even little slices of human beliefs and their consequences can be very important.
The marginal effects give us information about how the explanatory variables are related to the response individually. The model tells us that, on average, Democrats perceive the agency of welfare recipients (humanization) higher than non-Democrats (z=3.23, p=0.0012) and that those with higher racial zero-sum beliefs have lower perceptions of agency in welfare recipients (z=-4.414, p<0.0001). The marginal effect of White-poor beliefs does not reach traditional levels of statistical significance (z=1.85, p=0.06). Note that the response and explanatory variables have been z-score transformed so the units are in 'number of standard deviations.' That is, a unit increase is an increase equal to the standard deviation of the observed data.
To interpret the interactions, we test the effect of White-poor beliefs on the perceived agency of welfare recipients separately for people with high (+ 1 SD) and low (-1 SD) racial-zero-sum beliefs.
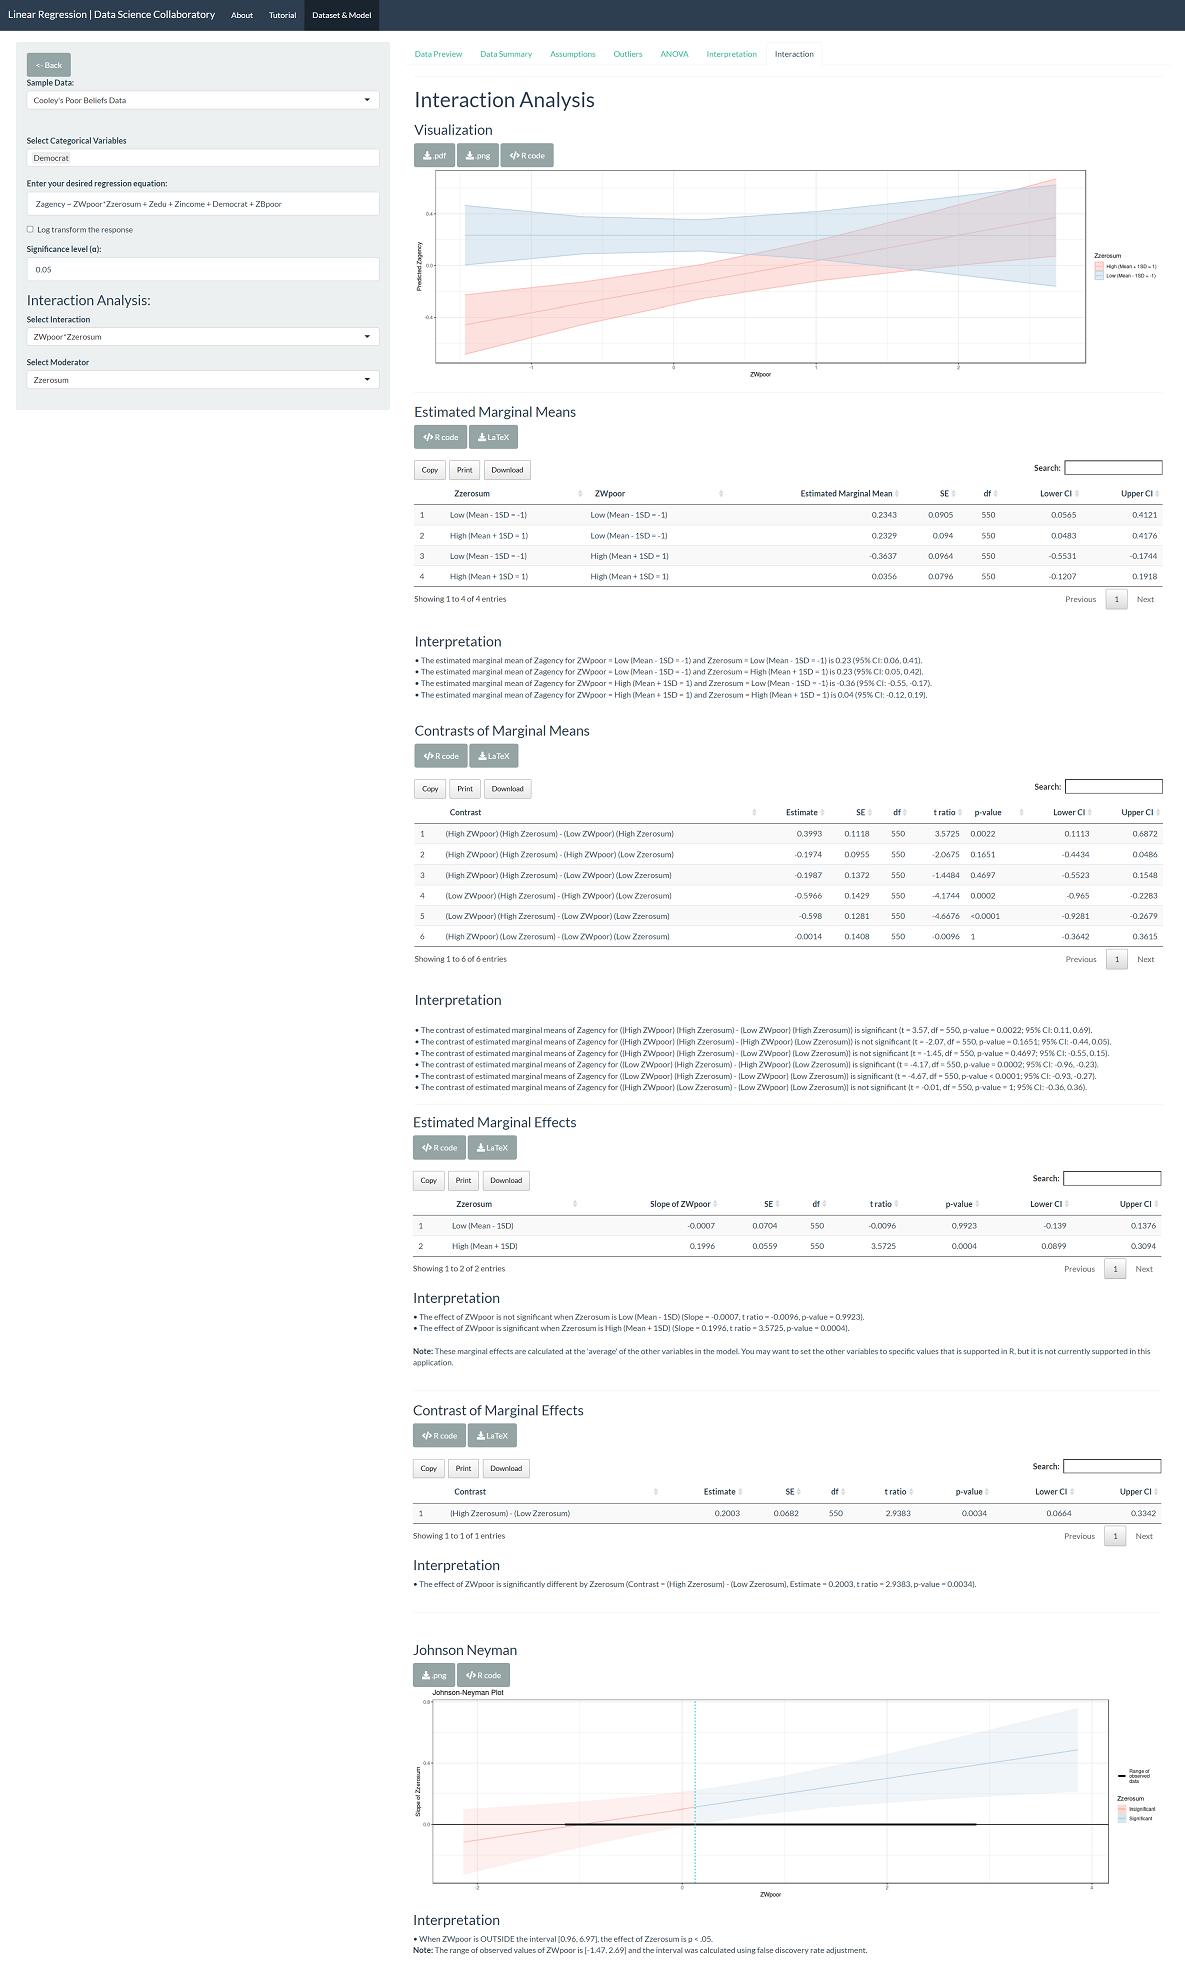
As the researchers predicted, among those high in racial-zero-sum beliefs, greater White-poor beliefs were associated with greater perceived agency of welfare recipients (slope=0.1996, t-ratio=3.5725, p=0.0004; 95% CI: 0.0899, 0.3094). In contrast, White-poor beliefs were not associated with the perceived agency of welfare recipients among those low in racial-zero-sum beliefs (slope=-0.0007, t-ratio=-0.0096, p=0.9923; 95% CI: -0.139, 0.1376).
In terms of significance testing, the Johnson Neyman analyses show that the effect of White-poor beliefs is significant when racial zero-sum beliefs are greater than 0.12. Noting that the predictors and response are z-score transformed, we note that this corresponds to racial zero-sum beliefs that are 0.12 standard deviations above the mean.
Cooley, E., Brown-Iannuzzi, J. L., Lei, R. F., Philbrook, L & Cipolli III, W. (2022). Beliefs that White People are Poor, Above and Beyond Beliefs that Black People are Poor, Predict White. White Paper, Colgate University.